5.2 Chart Type 3D / Heatmap View
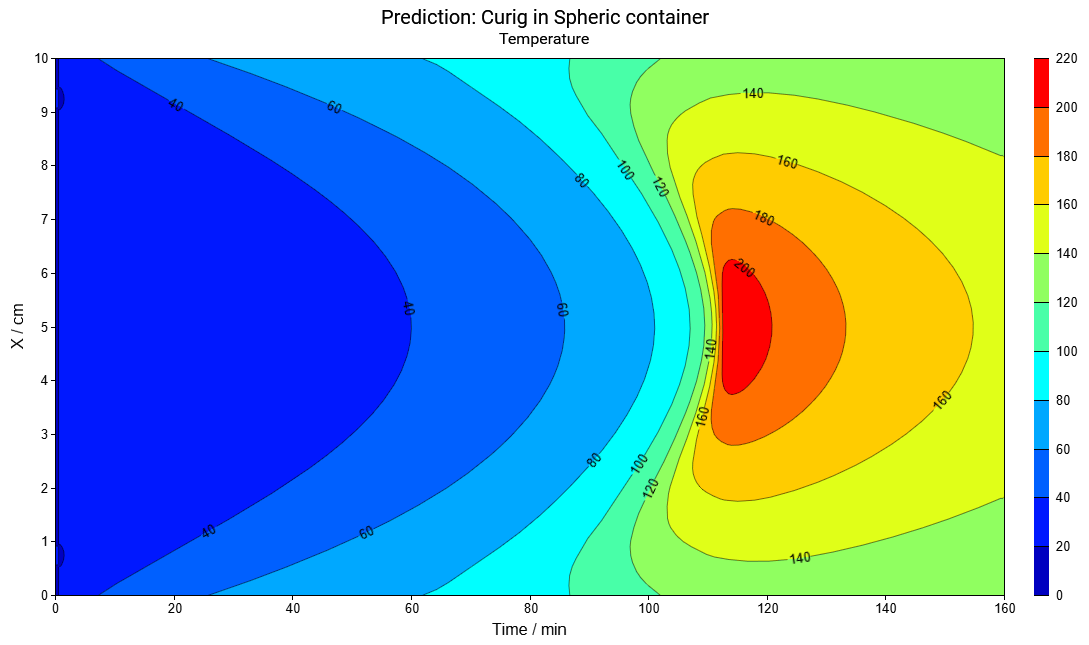
The simulated results can be presented in the view of the two-dimensional rectangular map as the function of X- coordinate and time. The color of each point corresponds to the simulated value. For one-dimensional shapes the X-coordinate is height (for slab) or diameter (for infinite cylinder or sphere).
5.2.1 One-Dimensional Containers
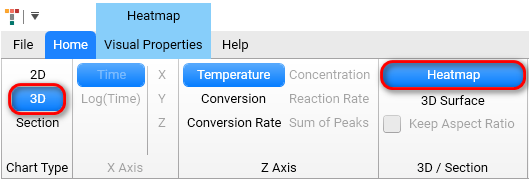
To have three-dimensional surface as the simulated results versus X-coordinate and time please select 3D in Chart Type group and Heatmap in 3D / Section group.
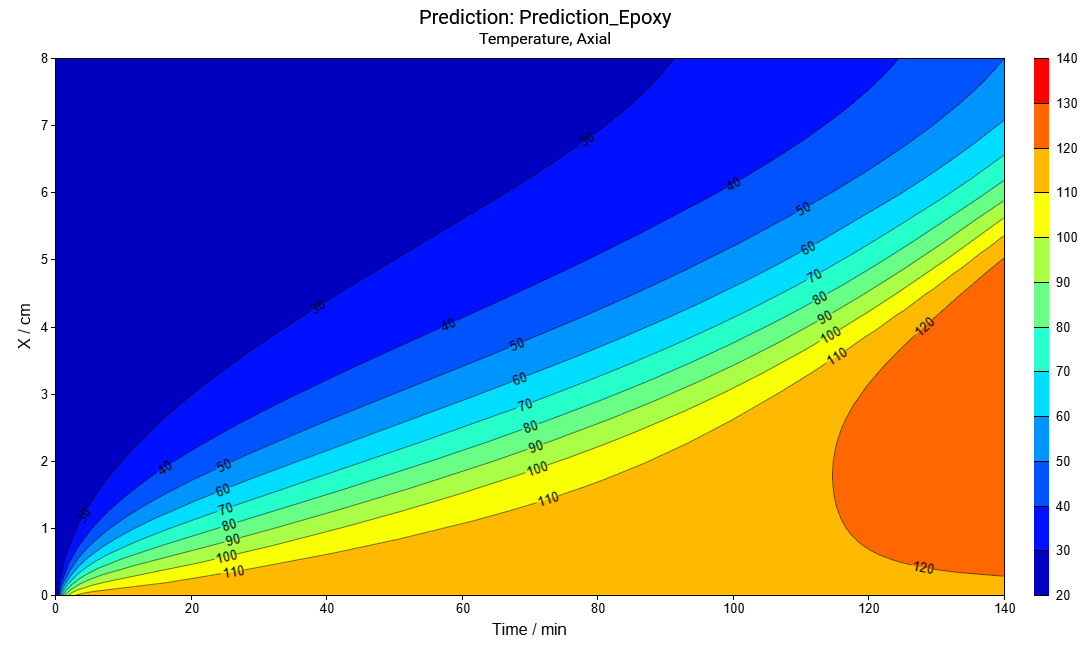
5.2.2 Two-Dimensional Containers, Axial Plane for Vertical Coordinate
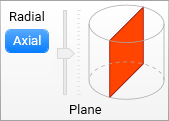
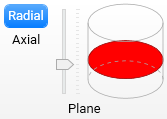
For two- dimensional shape, e.g., cylinder of finite height, the X-coordinate can be either vertical or horizontal coordinate depending on the settings selected by user in the group Plane (axial or radial).
Select Axial Plane to have the values on the vertical axis of cylinder as the function of vertical position and time.
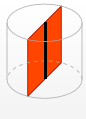
Black line in the second scheme corresponds to the vertical axis on heatmap.
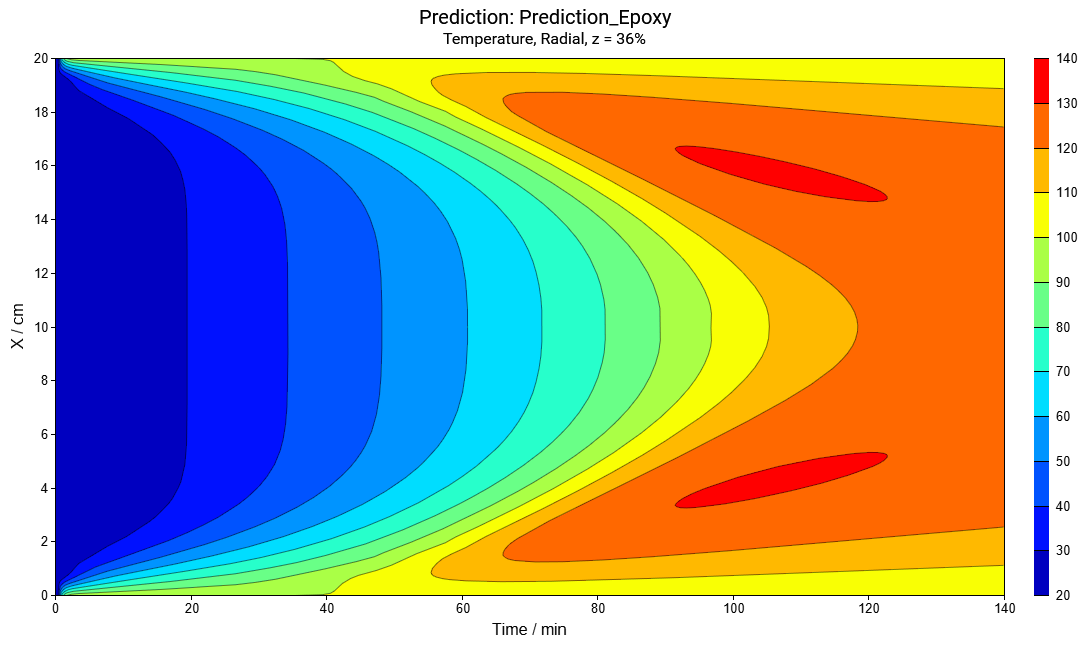
5.2.3 Two-Dimensional Containers, Radial Plane for Horizontal Coordinate
Select Radial Plane to have the values on the diameter of cylinder as the function of horizontal position and time. You can move the vertical slider in the Plane group in order to set the vertical position of the horizontal diameter.
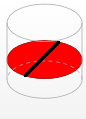
Black line in the second scheme corresponds to the vertical axis on heatmap.
Settings for 3D Heatmap chart type can be found in the ribbon tab group 3D Heatmap with tab Visual Properties, which is specific for the selected chart type. More information about settings can be found in the chapter Chart Type: 3D Heatmap.