5.3 Chart Type: 3D / Surface View
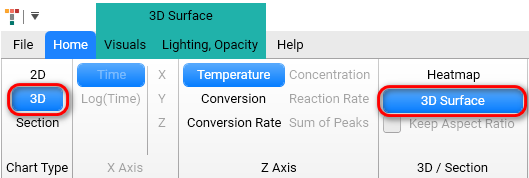
Here the selection between presentation as the 3D surface and 3D heatmap can be selected. 3D surface cold be rotated by the holding of the left mouse, button, or moved by the holding of the right mouse button. Rotation of the mouse wheel allow user for zoom 3D chart.
If you see to 3D surface from the top, then the resulting picture presents the same data like 3D heatmap. However, heatmap has special algorithm to fund contour lines to write the values on contour lines, therefore the number of color levels and contour lines for chart of 3D surface and 3D heatmap could be different.
5.3.1 Chart Type 3D / 3D Surface View
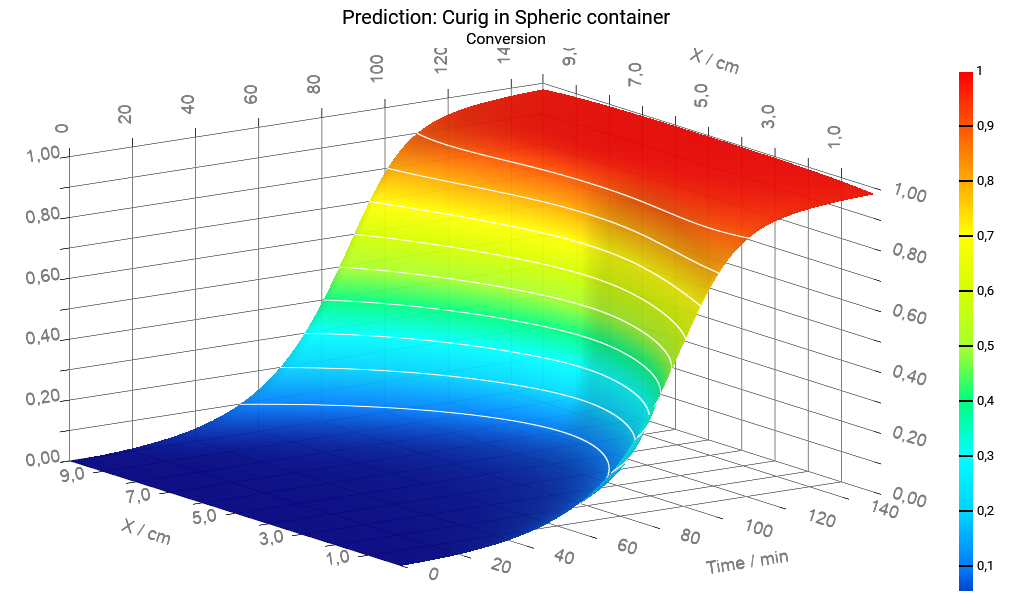
The simulated results can be presented in the view of the three-dimensional surface as the function of X-coordinate and time. For one-dimensional shapes the X-coordinate is height (for slab) or diameter (for infinite cylinder or sphere).
5.3.1.1 One-Dimensional Containers
To have three-dimensional surface as the simulated results versus X-coordinate and time please select 3D in Chart Type group and 3D Surface in 3D / Section group.

5.3.1.2 Two-Dimensional Containers, Axial Plane for Vertical Coordinate
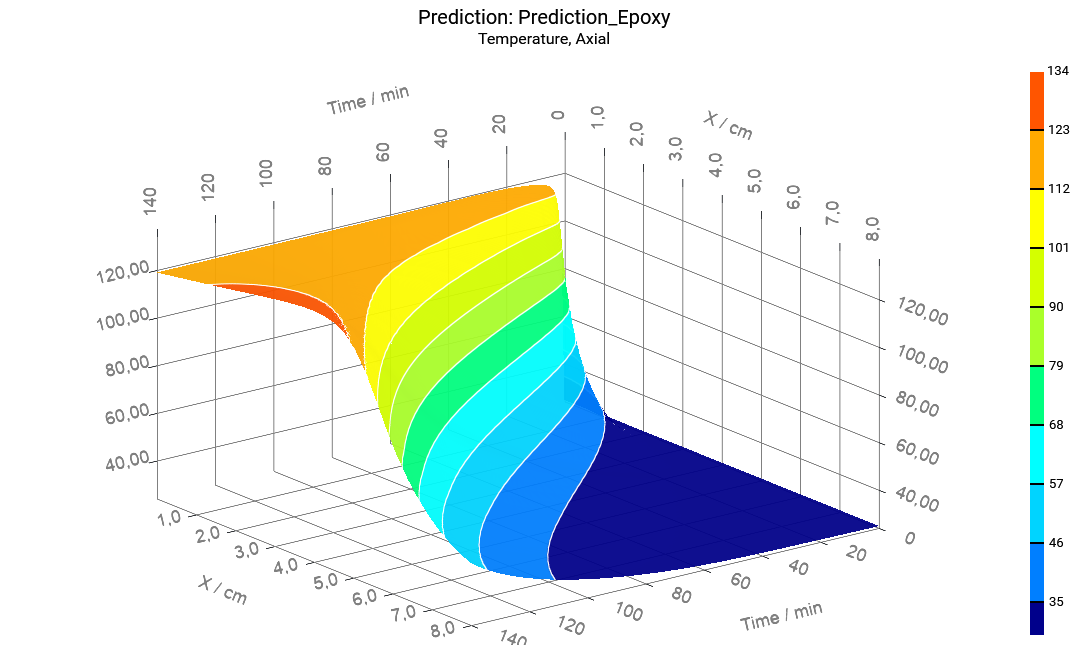
For two- dimensional container shape, e.g., cylinder of finite height, the X-coordinate can be either vertical or horizontal coordinate depending on the settings selected by user in the group Plane (axial or radial).
Select Axial Plane to have the values on the vertical axis of cylinder as the function of vertical position and time.
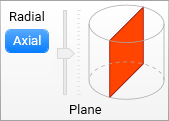

Black line in the second scheme corresponds to the X-axis on 3D Surface.
5.3.2 Two-Dimensional Containers, Radial Plane for Horizontal Coordinate
Select Radial Plane to have the values on the diameter of cylinder as the function of horizontal position and time. You can move the vertical slider in the Plane group in order to set the vertical position of the horizontal diameter.
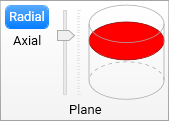

Black line in the second scheme corresponds to the X-axis on 3D Surface.
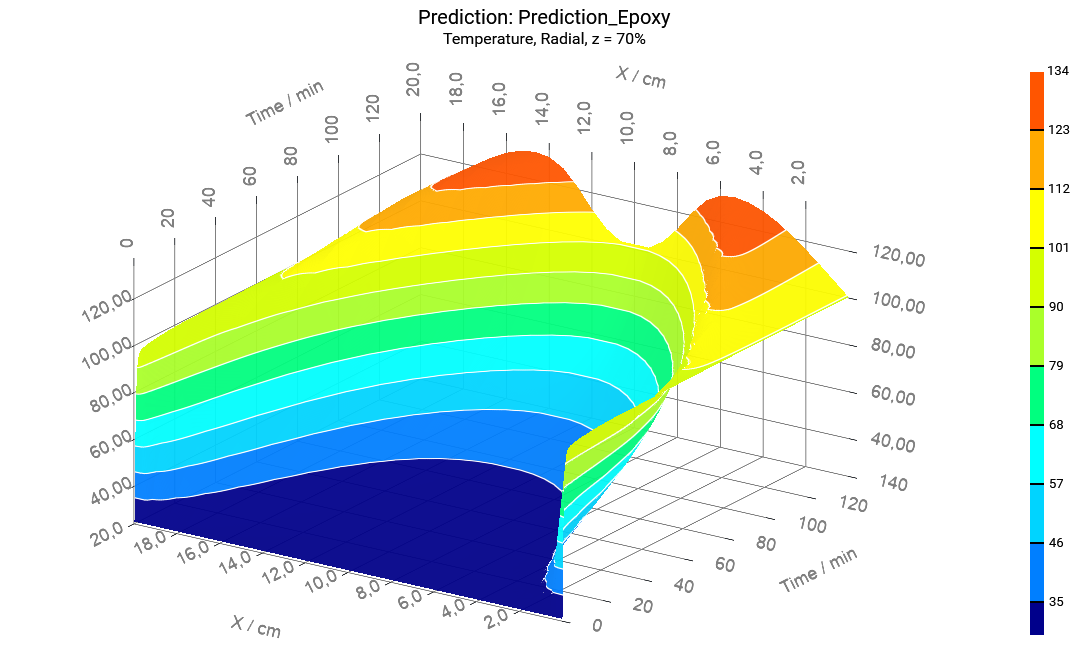
Settings for 3D Surface chart type can be found in the ribbon tab group 3D Surface with tabs Visuals and Lighting, Opacity, which is specific for the selected chart type. More information about settings can be found in the chapter Chart Type: 3D Surface.