5.4 Chart Type: Cross-Section / Heatmap View
The simulated results can be presented in the view of the two-dimensional map (in rectangular or polar coordinates) as the function of volume coordinates X and Y. The color of each point corresponds to the simulated value. For slab the X-coordinates are height and length, for infinite cylinder or sphere they present two perpendicular diameters with circle as the cross-section.
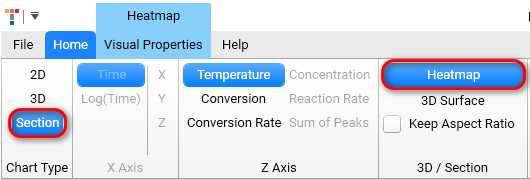
On the bottom of the chart area the horizontal panel 3D Section Settings is shown if the Section is selected in the Chart Type group. Here you can set the time point at which the cross-section should be shown. Please see information about it in the chapter: Cross-Section Surface.
5.4.1 Keep Aspect Ratio
Used to switch on or off the real aspect ratio for Cross-Section Heatmap chart.
OFF (default): the chart fills the full space; the size of the X and Y sides do not follow the real aspect ratio of the used container for selected prediction.
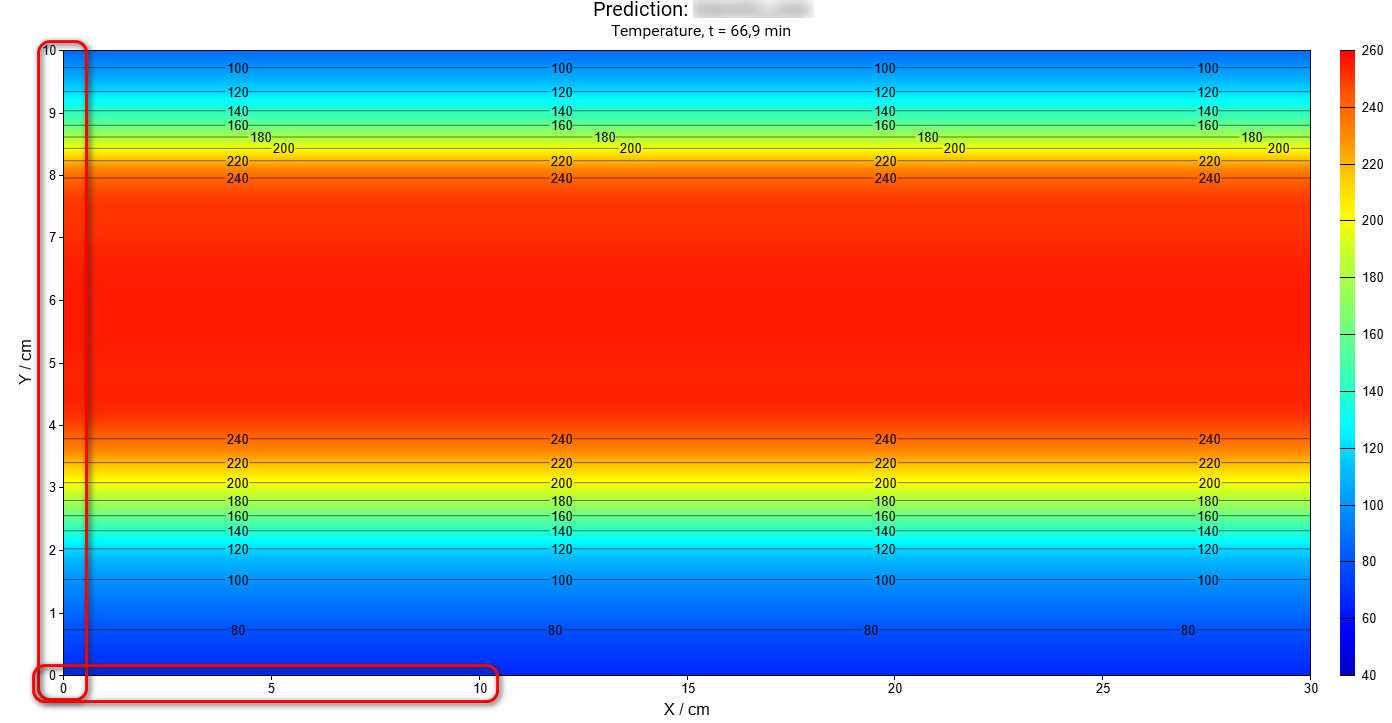
As you see, the site of 0..10 range is different on horizontal and vertical sides of the chart.
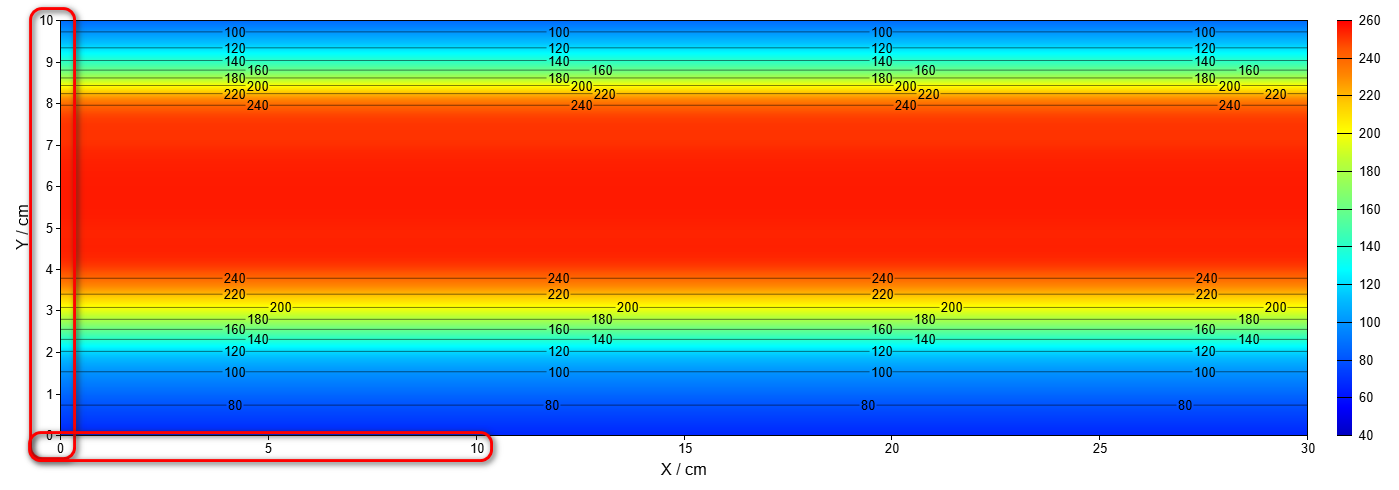
ON: the chart keeps the aspect ratio of the container used in this prediction; the size of the data range on X and Y sides is the same.
5.4.2 One-Dimensional Containers
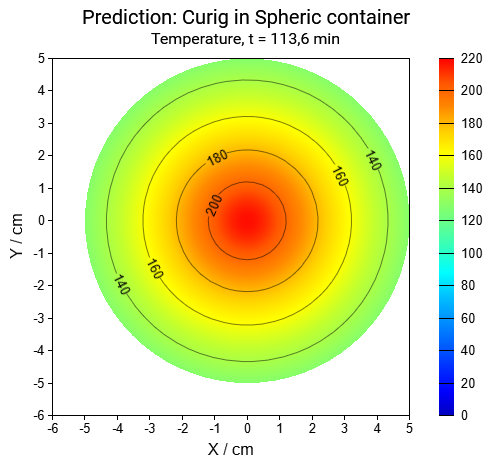
Move time slider to the time point of your interest and you will see the results on the cross-section at this time point.
5.4.3 Two-Dimensional Containers, Axial Plane for Vertical Cross-Section
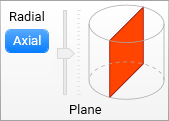
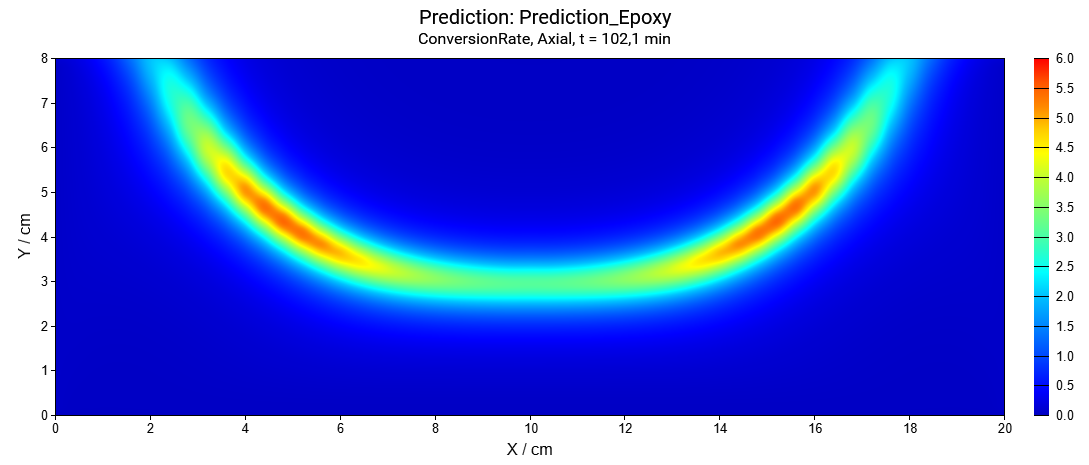
For two- dimensional container shape, e.g., for finite cylinder the cross-section can be either vertical (rectangular) or horizontal (circle) depending on the settings selected by user in Plane group (Axial or Radial) of Home ribbon tab.
Select Axial plane to have the vertical cross-section for cylinder:
5.4.4 Two-Dimensional Containers, Radial Plane for Horizontal Cross-Section
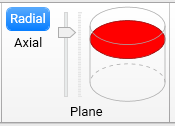
The result for horizontal cross-section depends on its vertical position, which can be set by the vertical slider in group Plane of the Home ribbon tab.
Select Radial Plane to have the horizontal cross-section for cylinder and move the vertical slider in order to set the vertical position:
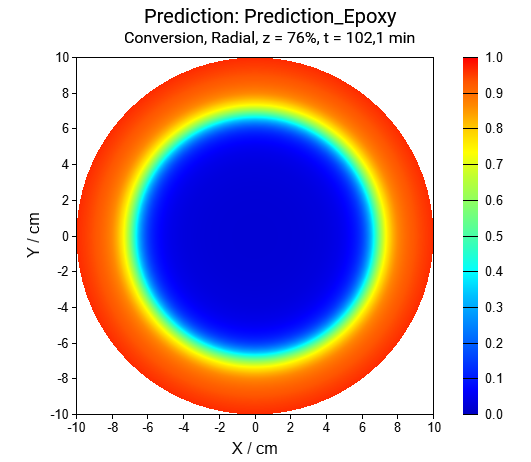
The vertical position of horizontal cross-section in percentage of height is presented as the z-value in the title of the chart.
Settings for 3D Heatmap chart type can be found in the ribbon tab group 3D Heatmap with tab Visual Properties, which is specific for the selected chart type. More information about settings can be found in the chapter Chart Type: 3D Heatmap.