5.5 Chart Type: Cross-Section / 3D Surface View
The simulated results can be presented in the view of the three-dimensional surface (in rectangular or polar coordinates) as the function of volume coordinates X and Y. For slab these coordinates are height and length, for infinite cylinder or sphere they present two perpendicular diameters with circle as the cross-section.
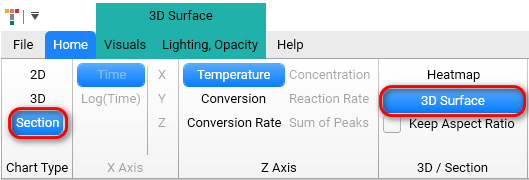
This view gives the possibility to see the prediction in 2 spatial coordinates for different time frames. You can set the desired time frame manually of activate automatic playback from the start to the end time frame defined in prediction.
It is also possible to record the automatic playback to an external video file.
Special “3D Section Settings” panel helps you to manage this functionality.
5.5.1 3D Section Settings
On the bottom of the chart area the horizontal panel 3D Section Settings is shown if the Section is selected in the Chart Type group.

The 3D Section Panel has different control:
-
Rewind to Begin sets time point to the starting time frame:
-
The slider (6) will set to the leftmost position,
-
Current Time Frame (4) will be set to 0 minutes.
-
-
Play starts or resumes animation from the current time frame.
-
Start Video Recording creates a new video file and starts recording of the from the current time frame.
-
Current Time Frame. Can be set manually.
-
OK button confirms manually changed Time Frame.
-
Time Slider shows the position of the current time frame in whole time range for current prediction. Slider can be moved manually with the mouse.
-
Last Recorded Video File for current prediction. You can click on the file path to start the video in your standard video playback software (like Microsoft Media Player or similar).
Right mouse click on the file name shows context menu with possibility to open the file folder where the video is saved:
When you start video recording then some controls are changed:

-
Blinked red circle shows that the video is recorded now.
-
Stop Video Recording button stops the video recording and saves the video file on the hard drive.
When video is stopped then the Last Video file name (7) is changed, and newly recorded video can be played in external video playing software.
5.5.2 One-Dimensional Containers
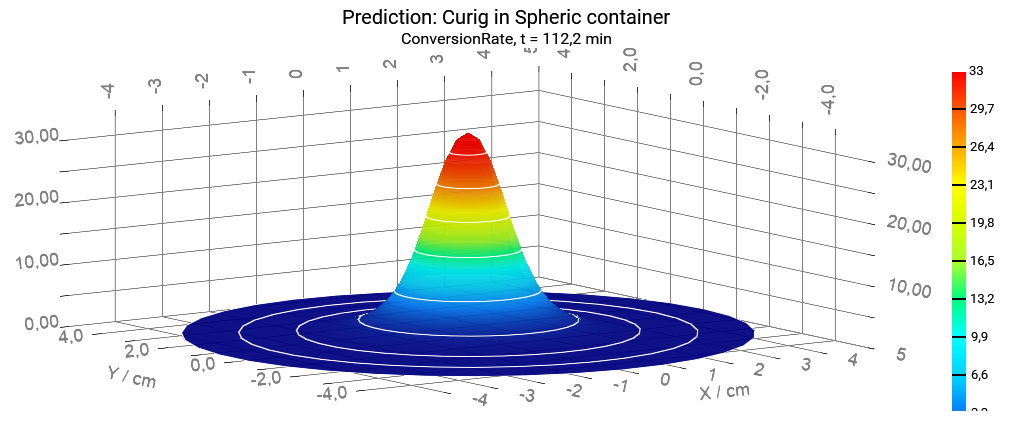
Move time slider to the time point of your interest and you will see the results on the cross-section at this time point.
5.5.3 Two-Dimensional Containers, Axial Plane for Vertical Cross-Section
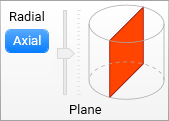
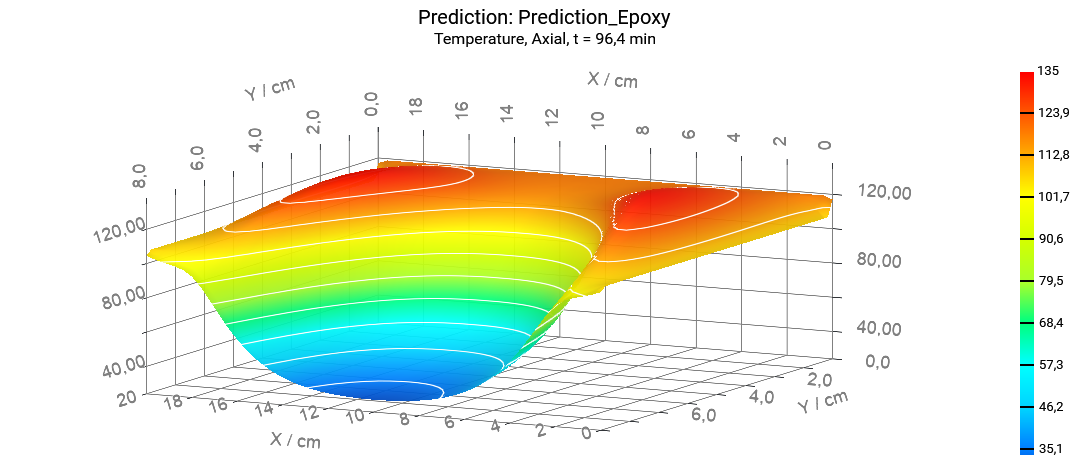
For two- dimensional container shape, e.g., for finite cylinder the cross-section can be either vertical (rectangular) or horizontal (circle) depending on the settings selected by user in Plane group (Axial or Radial) of Home ribbon tab.
Select Axial plane to have the vertical cross-section for cylinder or Rotational shape:
Note: The Axial cross-section for the Rotational shape can be presented in Heatmap view only. It cannot be presented in 3D Surface view by design because of complexity of the results interpretation.
5.5.4 Two-Dimensional Containers, Radial Plane for Horizontal Cross-Section
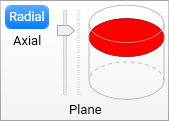
The result for horizontal cross-section depends on its vertical position, which can be set by the vertical slider in group Plane of the Home ribbon tab.
Select Radial Plane to have the horizontal cross-section for cylinder or Rotational shape and move the vertical slider in order to set the vertical position:
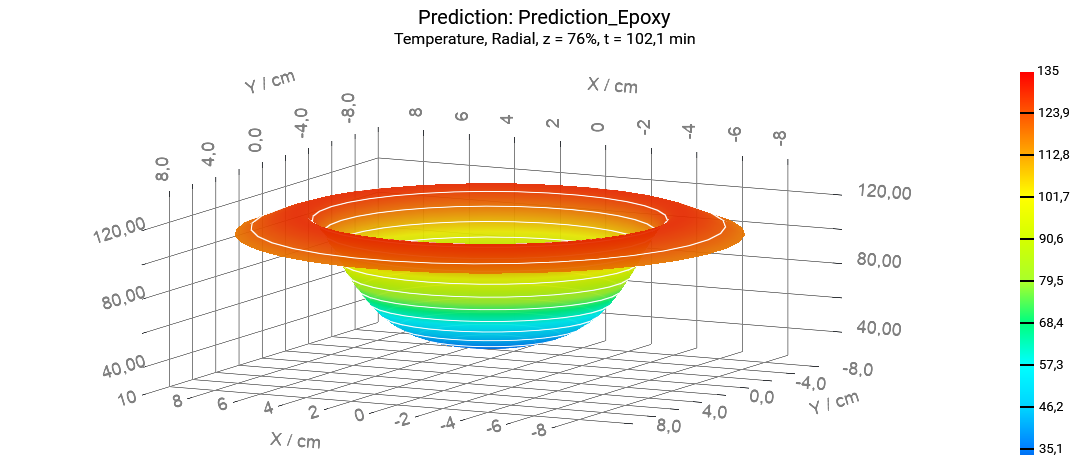
The vertical position of horizontal cross-section in percentage of height is presented as the z-value in the title of the chart.
Settings for 3D Surface chart type can be found in the ribbon tab group 3D Surface with tabs Visuals and Lighting, Opacity, which is specific for the selected chart type. More information about settings can be found in the chapter Chart Type: 3D Surface.